Industry Economics Worldwide Power BI User Guide
Introduction
The Intratec Industry Economics Worldwide Power BI Dashboard is a pre-configured, open-source project file (.pbix) that provides straightforward access to Intratec Industry Economics Worldwide data. It can be used as a starting point for experienced users to develop more complex applications or as a ready-to-use simple dashboard for those in need of an easy way to access the data provided by Intratec.
Intratec also provides short tutorial videos on how to use the Intratec Industry Economics Worldwide Power BI Dashboard at https://intrat.ec/iiew-power-bi-videos.
Anyone can use the Intratec Industry Economics Worldwide Power BI Dashboard to access free sample data using the courtesy account pre-configured within the file. To access the full extent of Intratec Industry Economics Worldwide through the Power BI Dashboard, users must subscribe to the Advanced Plan of Intratec Industry Economics Worldwide.
File Structure
The Intratec Industry Economics Worldwide Power BI Dashboard is divided into pages, which can be navigated through the left bar on Power BI online, as shown in the screenshot below.
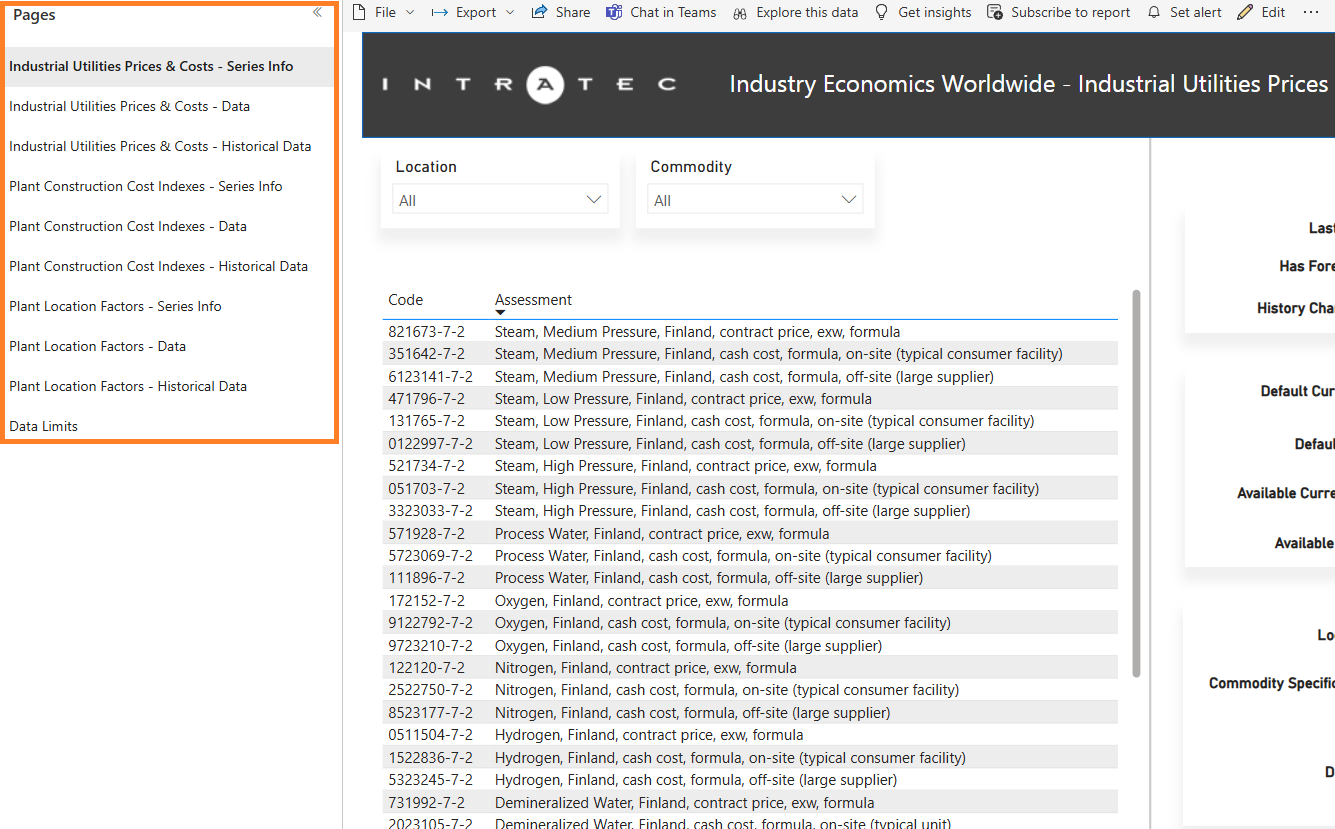
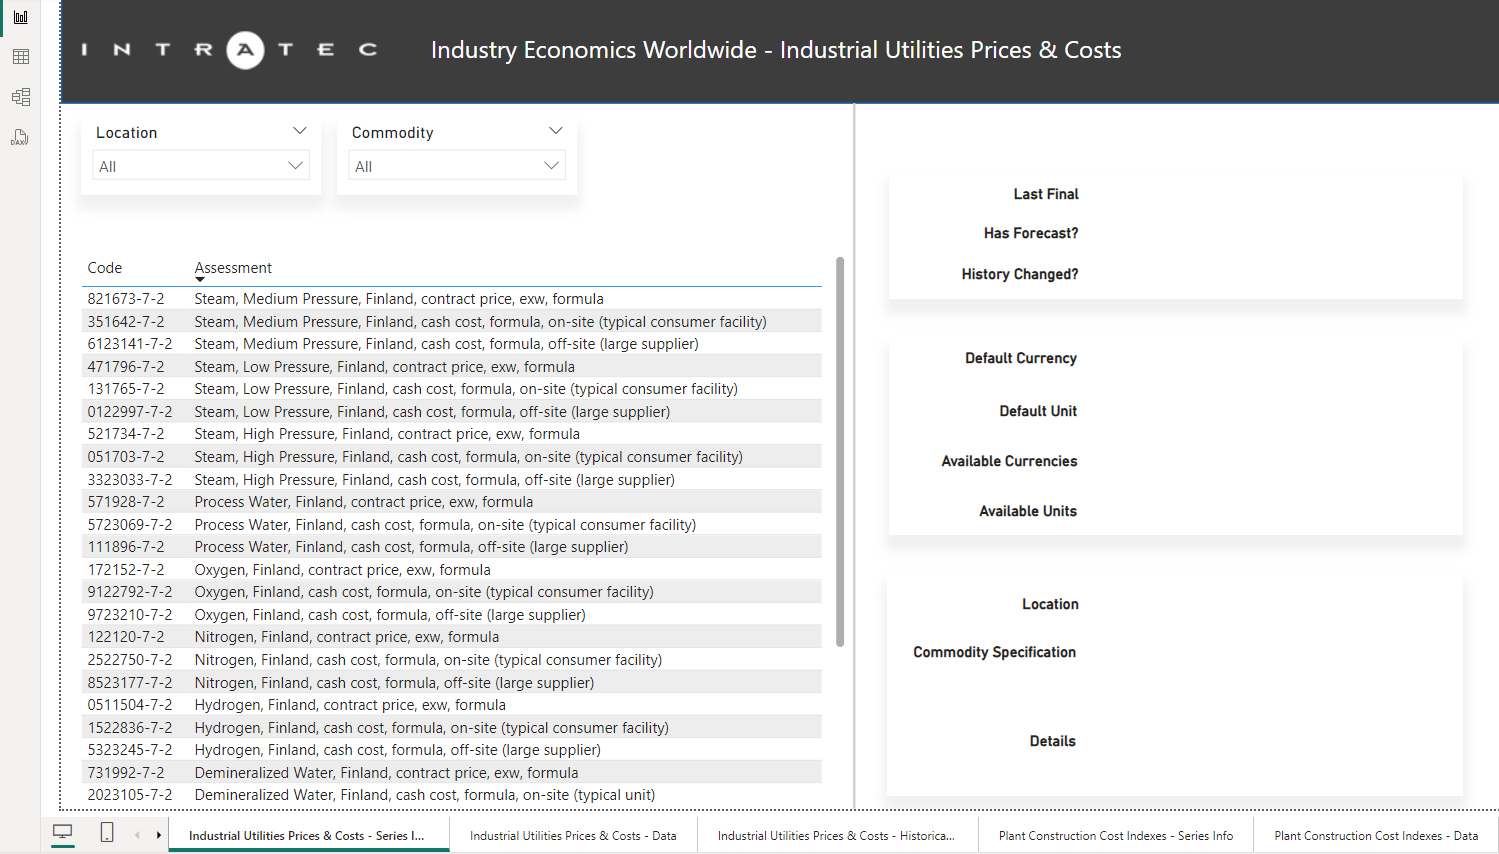
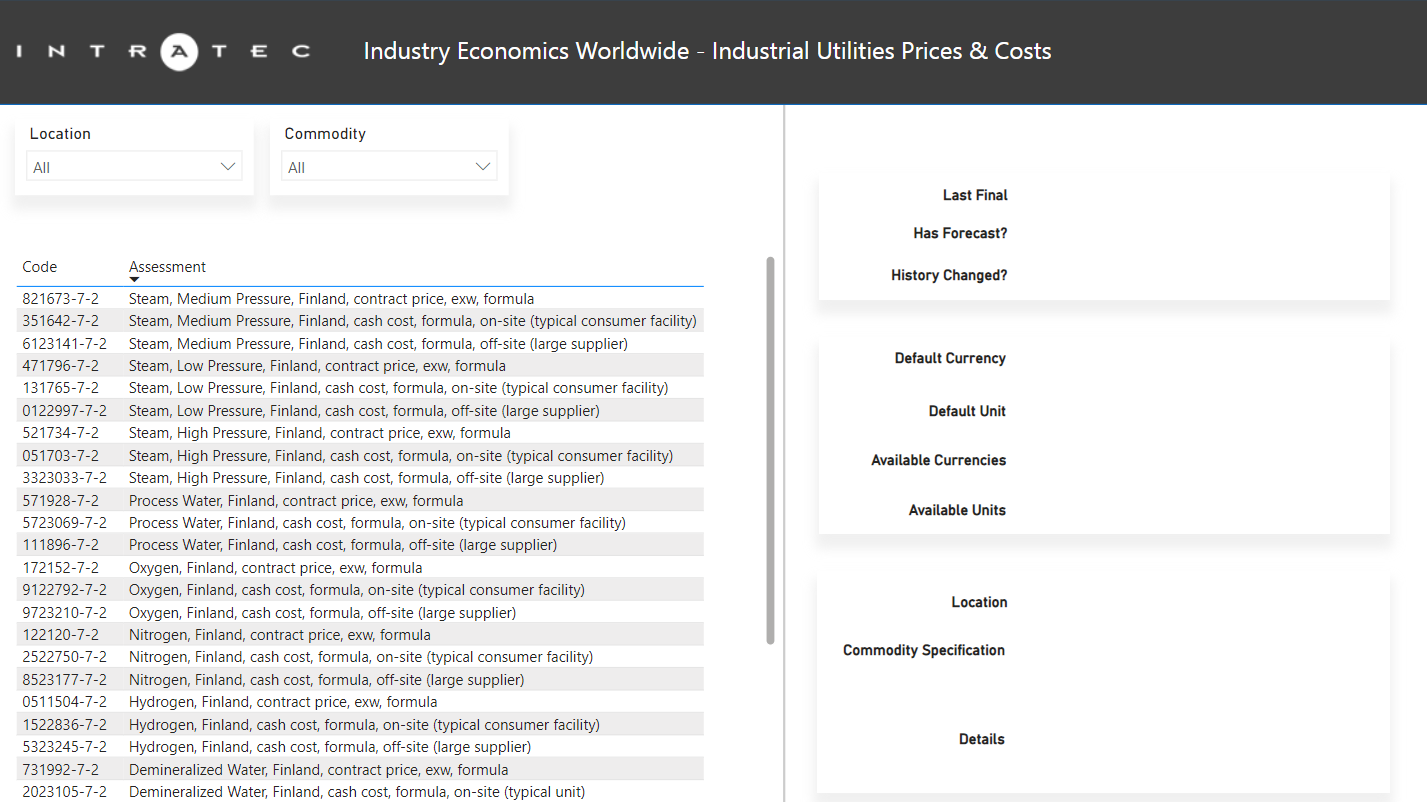
Series Info
These pages present the description of all the available series under the subscription, for each data type comprised in Intratec Industry Economics Worldwide. In these pages, a table on the left lists the available series (assessments) along with the unique codes used to identify each of them.
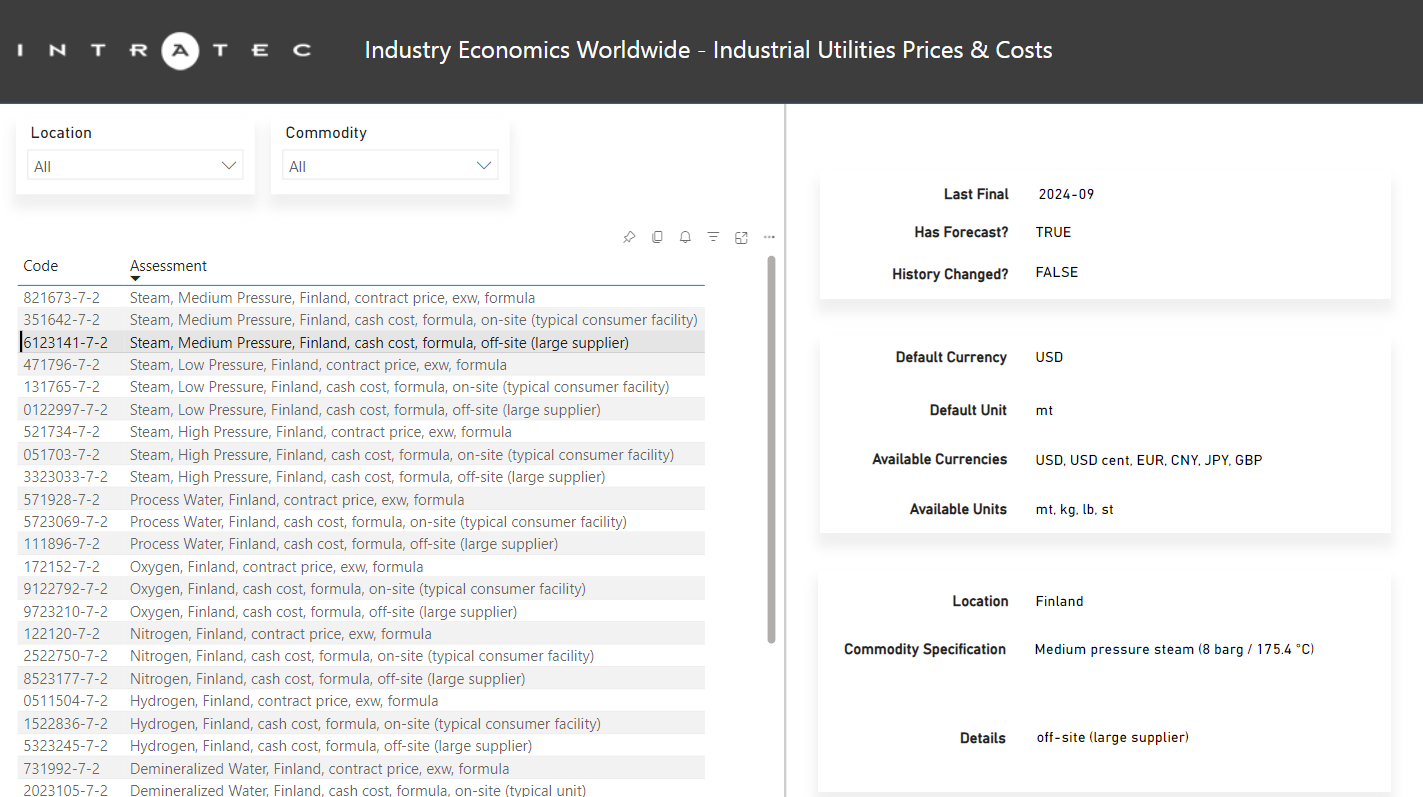
By selecting an assessment on the Industrial Utilities Prices & Costs - Series Info page, the user may check the following details on the right side of the dashboard:
- Last Final: Date of the latest final data point available for the assessment (data points for later dates are preliminary).
- Has Forecast?: Specifies if forecasts are available (TRUE/FALSE).
- History Changed?: Specifies if the user should request historical data points. This is particularly useful when new data assessments are created or if revisions have been made to existing data assessments (TRUE/FALSE).
- Default Currency: Shows the default currency in which the assessment data is displayed.
- Default Unit: Shows the default unit in which the assessment data is displayed.
- Available Currencies: Displays the available currencies for conversion.
- Available Units: Displays all the available units for conversion.
- Location: The location dataset the assessment belongs to.
- Commodity Specification: Describes the specifications of the commodity approached by the price assessment.
- Details: Relevant information complementing the assessment description.
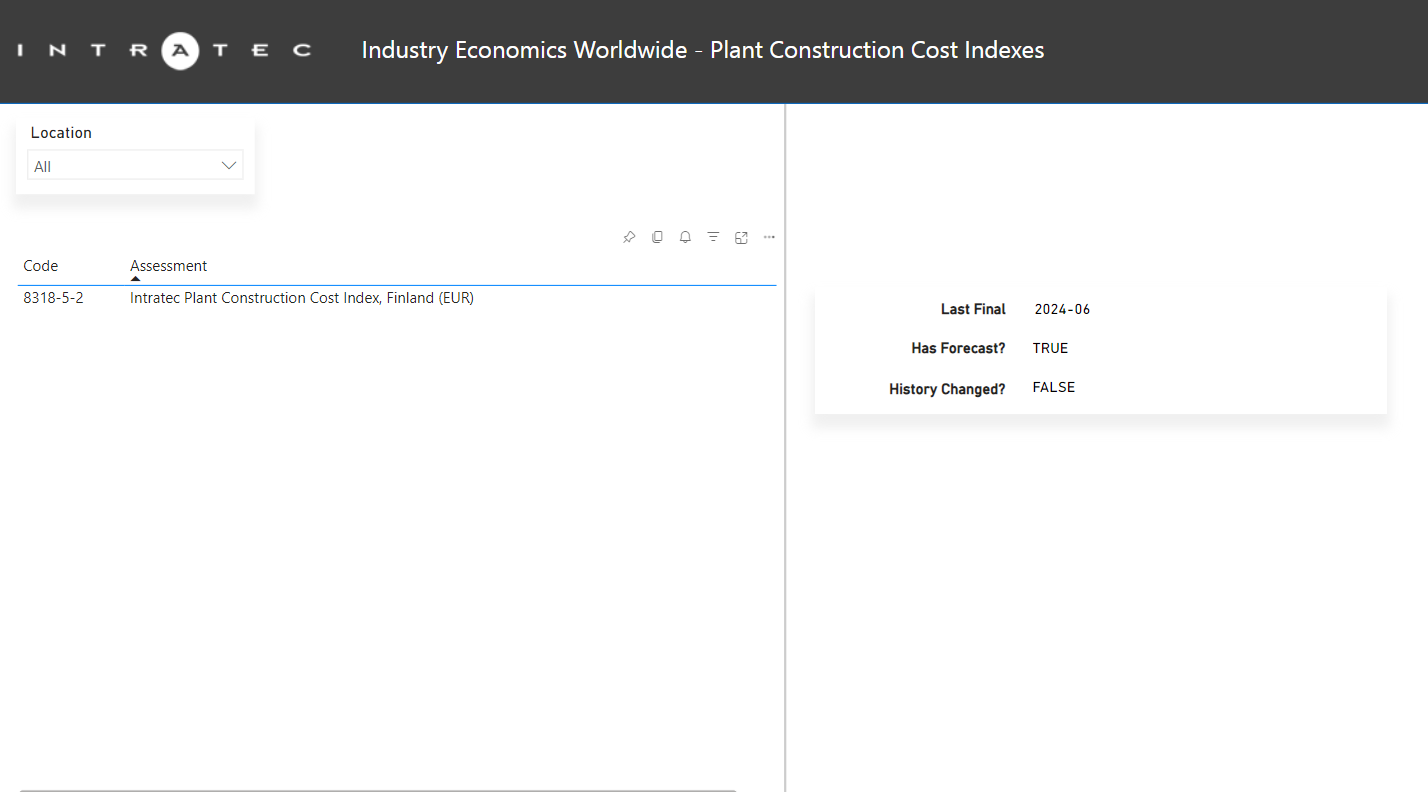
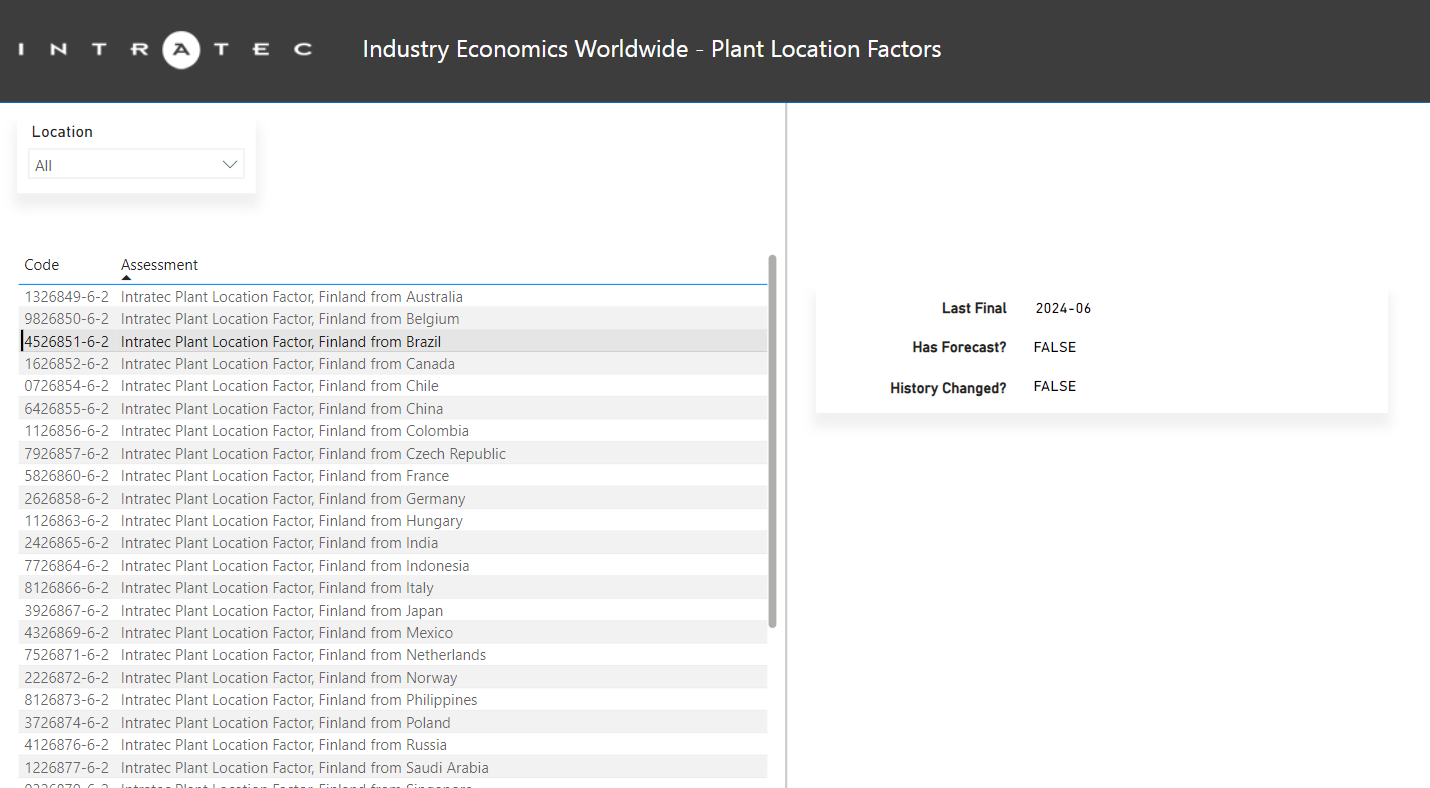
The Plant Construction Cost Indexes - Series Info and Plant Location Factors - Series Info pages are simpler, and only display the Last Final, Has Forecast?, and History Changed? fields.
The Series Info pages allow users to identify and select the relevant assessments. The corresponding codes can then be used to retrieve both current and historical data for those series.
Data
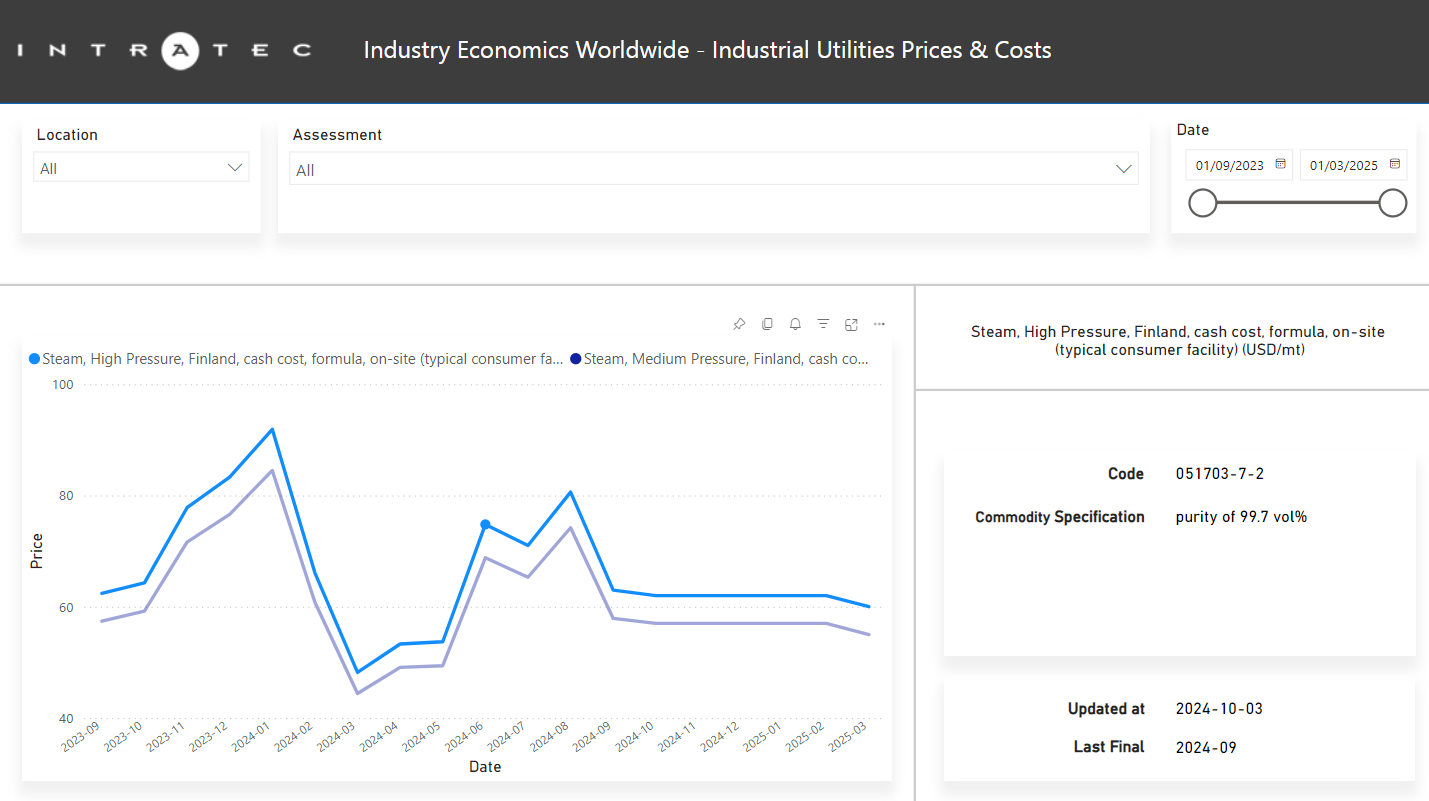
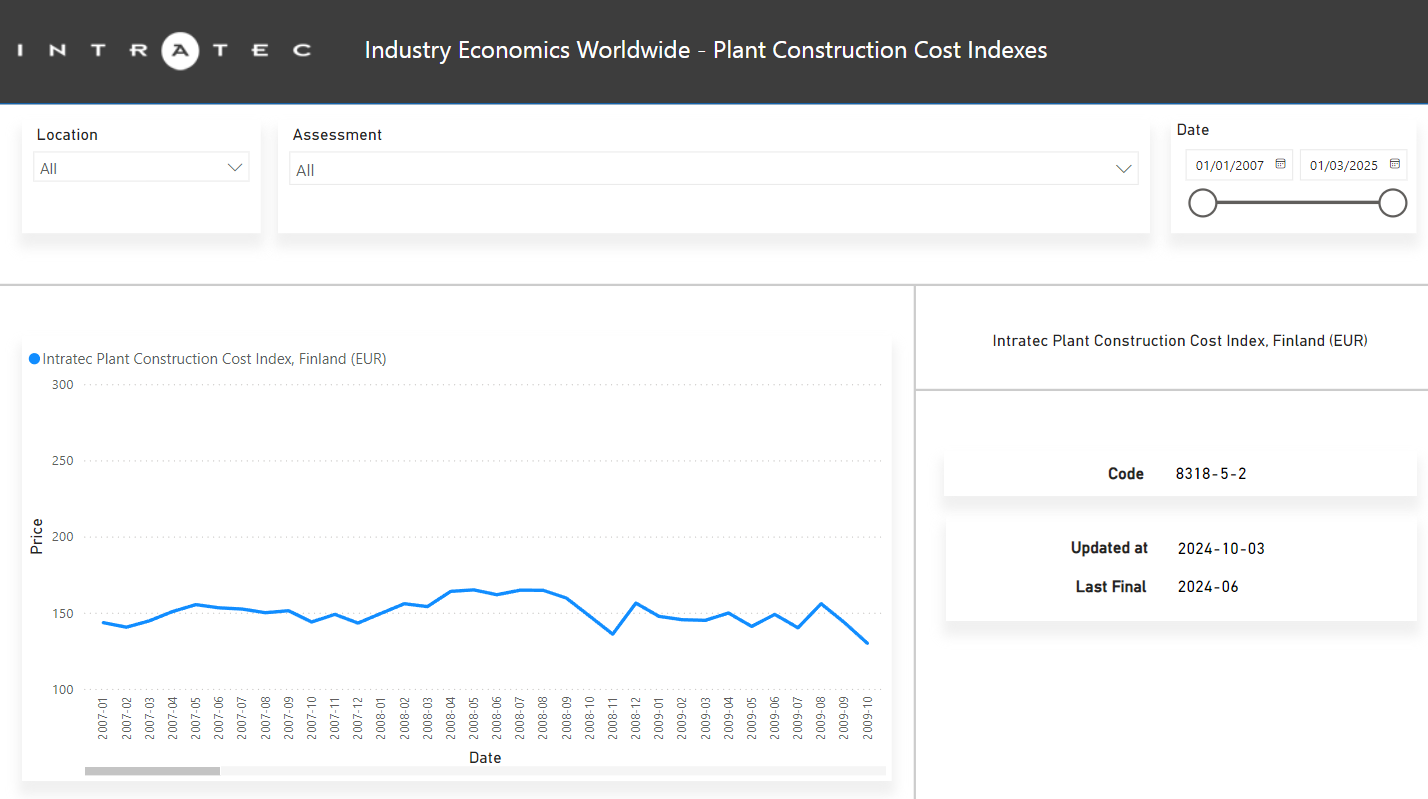
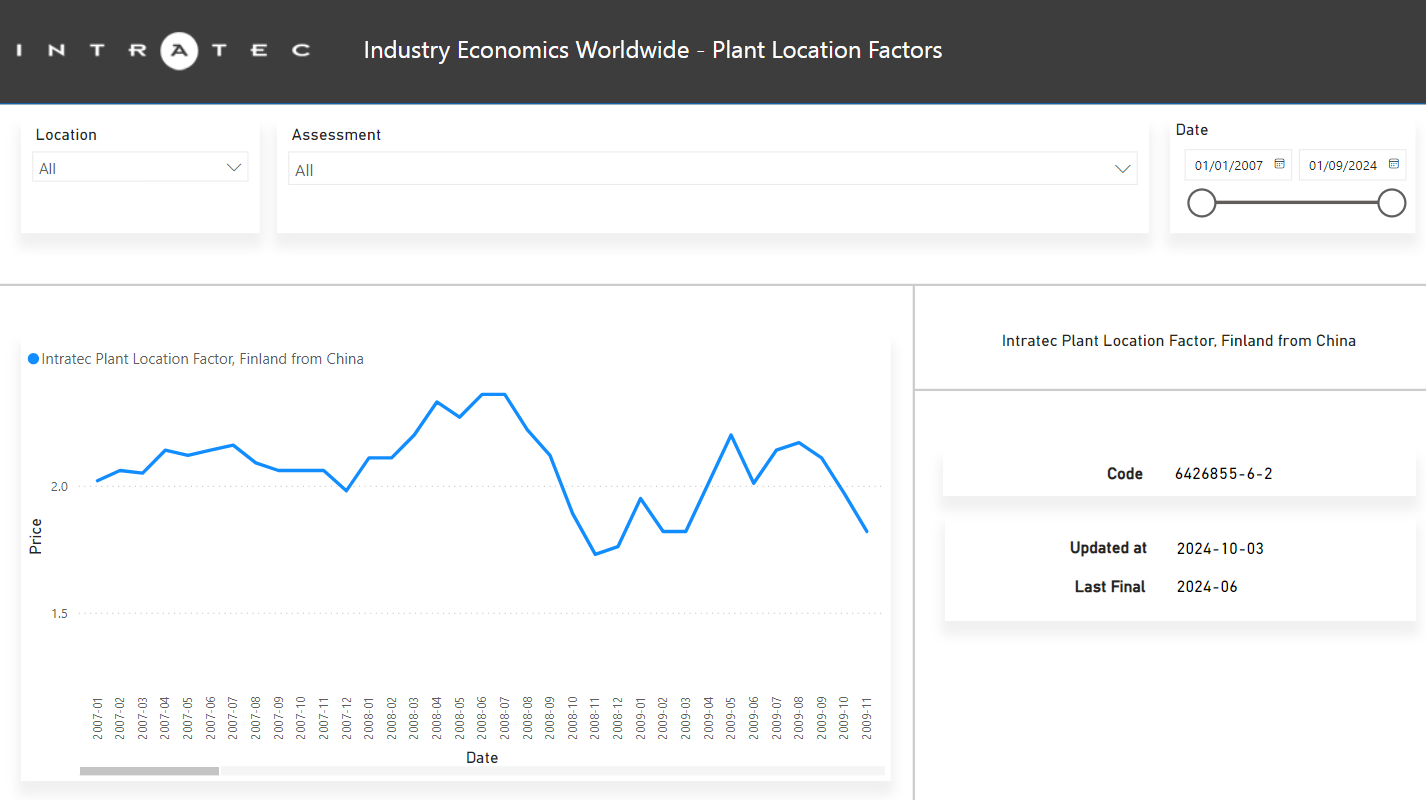
The Data pages display the last 13 months of data up to the most recently concluded month for each requested assessment, along with short-term forecasts for the subsequent six months when available. These pages feature a chart and intuitive controls for customizing the data display. Users can use the filters at the top of the page to narrow down data by location, assessment, or date range. Additionally, by selecting a curve in the chart, detailed information will appear in the panel on the right.
Historical Data
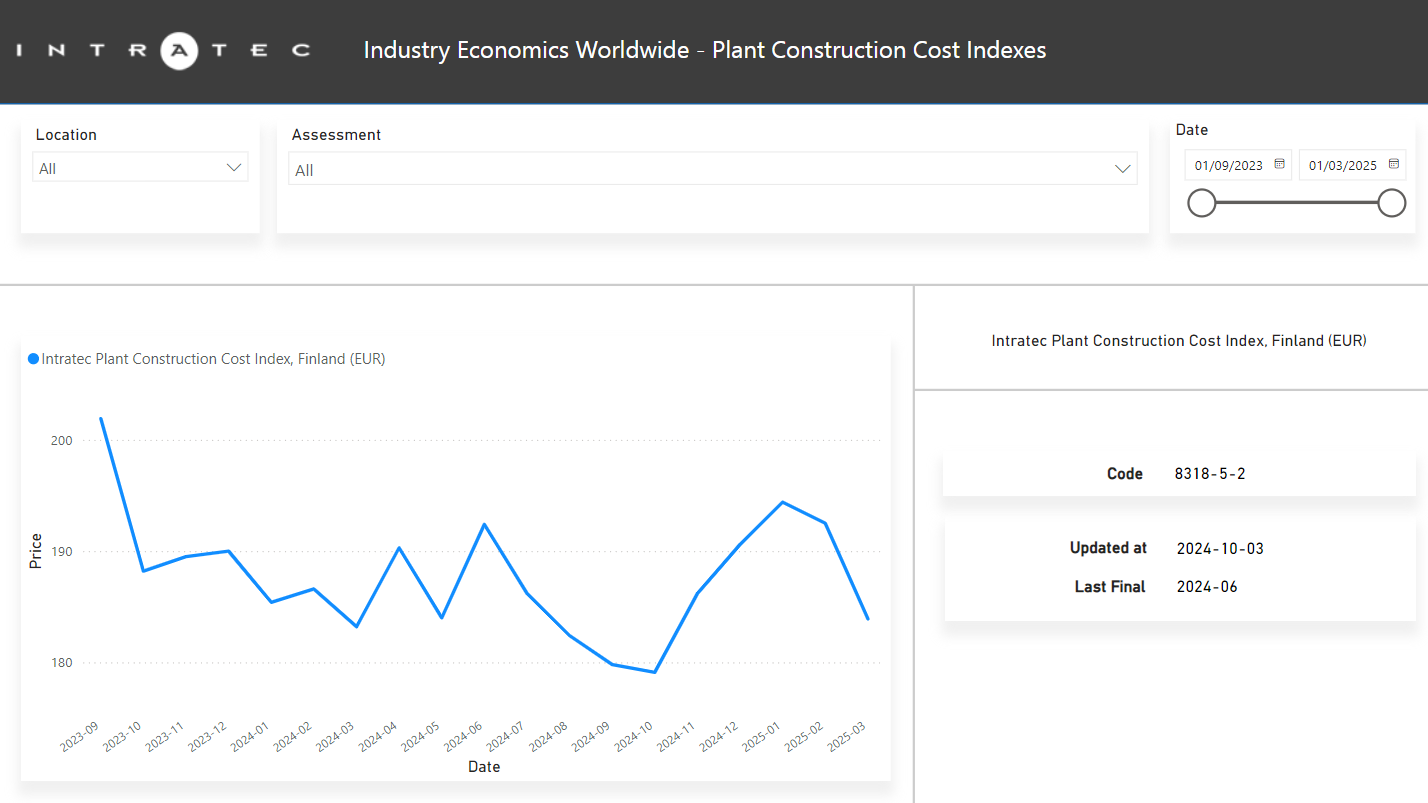
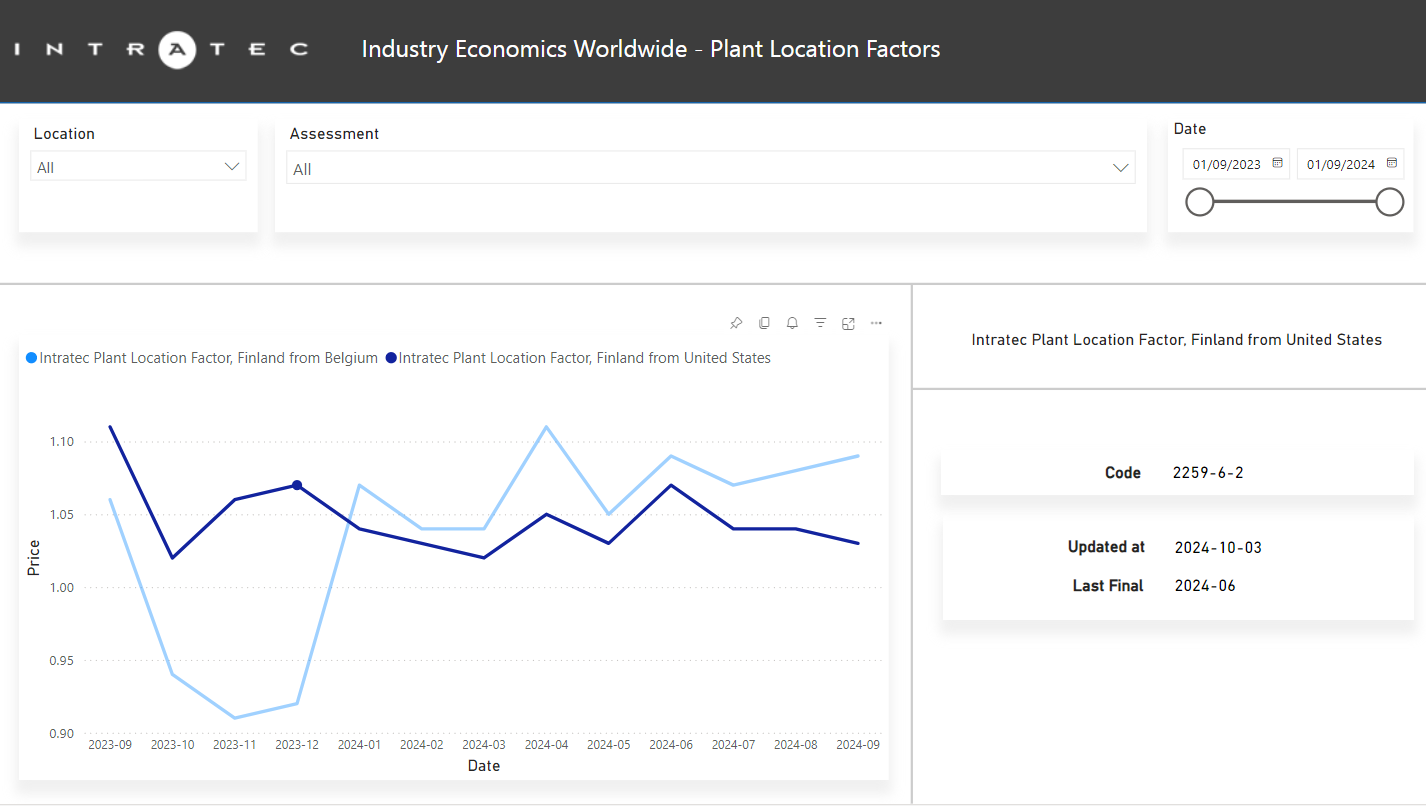
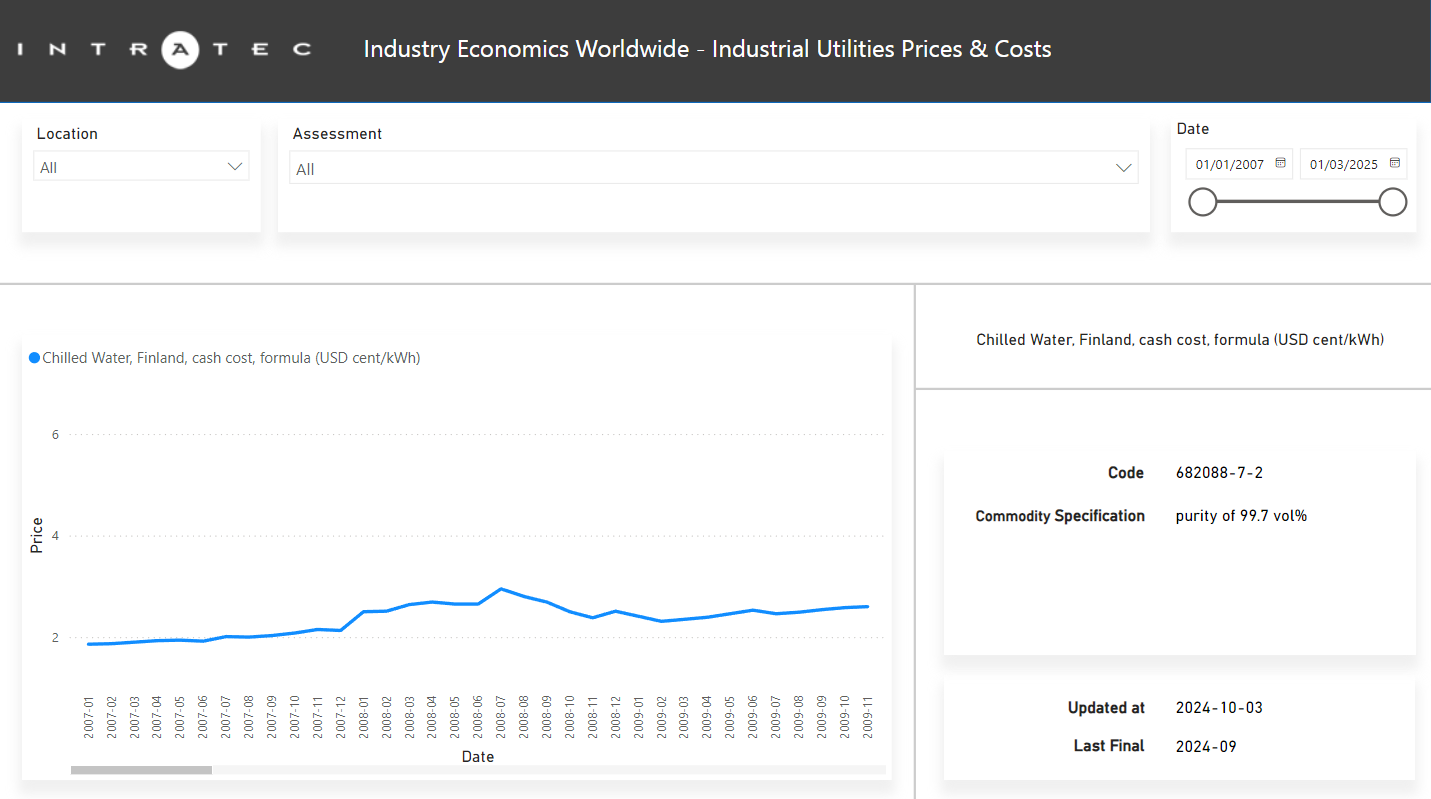
The Historical Data pages are like the Data pages, except that they present the whole series data history for the selected assessments. The controls and functionalities are the same as the Data pages explained above.
Historical data availability is subject to the subscription plan conditions. Check if your account has the required automation tier by logging in the Intratec website and accessing https://www.intratec.us/account/log-in.
Data Limits
This page provides an overview of the number of requests made during the current month. Users can select their subscription's location and track both the number of requests used and the total requests available each month.
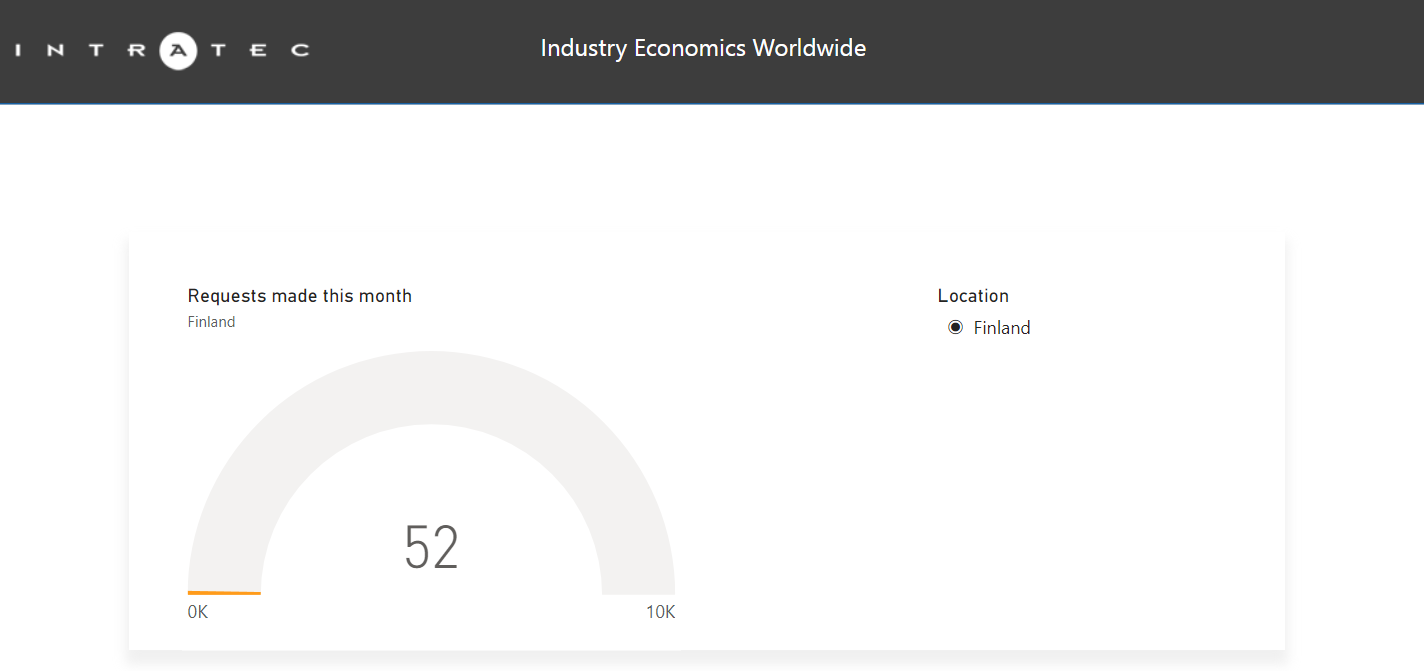
Requests are counted based on the number of data series codes submitted to Intratec's servers. Each dataset has a specific request limit, and the remaining requests are reset when new data is released, following our Release Schedule.
Set up File
Download and publish the file online. Before starting, make sure to have Power BI Desktop installed on the computer and to be logged in with a valid Microsoft account.
Step-by-Step
- Download the newest version of the Intratec Industry Economics Worldwide Power BI Dashboard at https://intrat.ec/iiew-power-bi-download.
- Open the file.
- Click the Publish button on the top-right ribbon.

This will make the dashboard available to access via Power BI online.
- Select a private workspace to publish the dashboard, click Select, and wait for it to load.
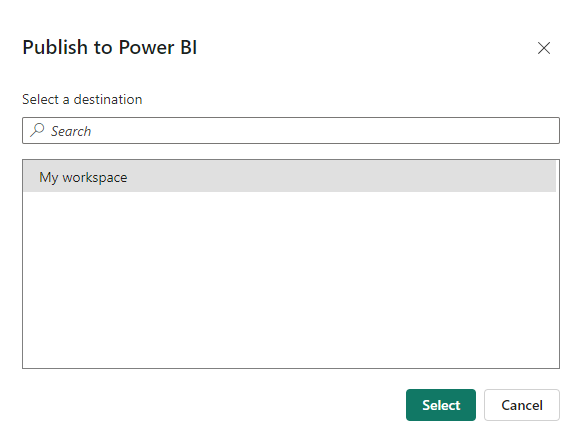
Be sure to publish the dashboard to a private workspace, as the access credentials are stored in a parameter that could be seen by anyone with access to the dashboard.
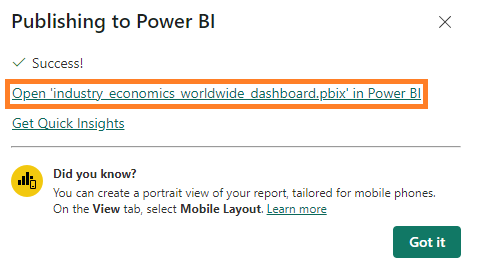
- Click on Open 'industry_economics_worldwide_dashboard.pbix' in Power BI to access it in the web browser.
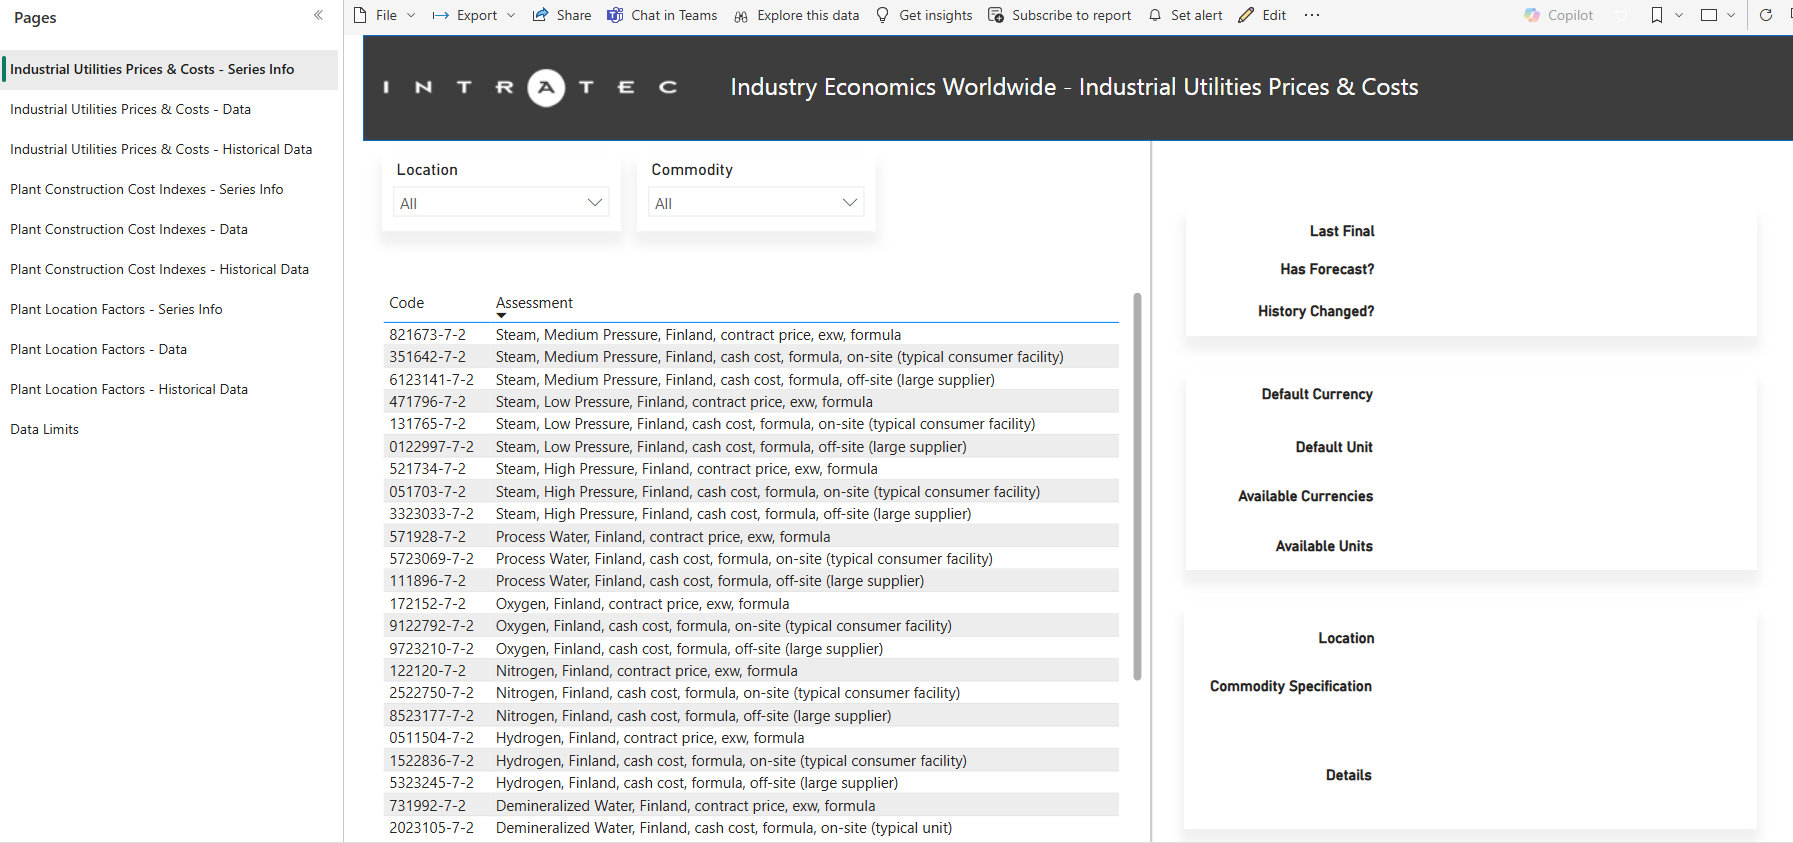
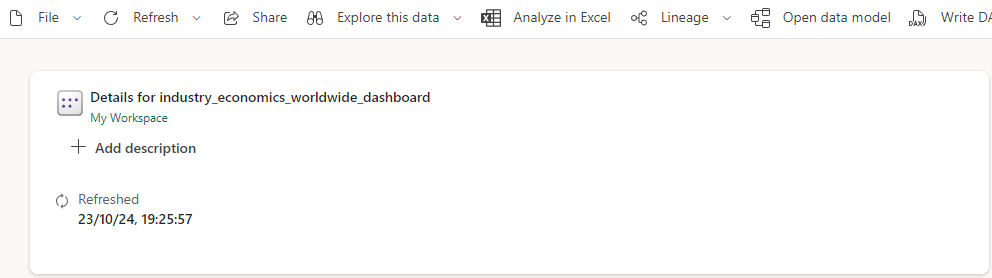
Once opened, the dashboard should look like the following in the web browser:
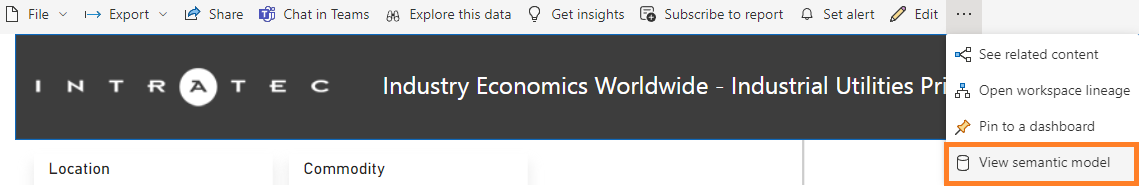
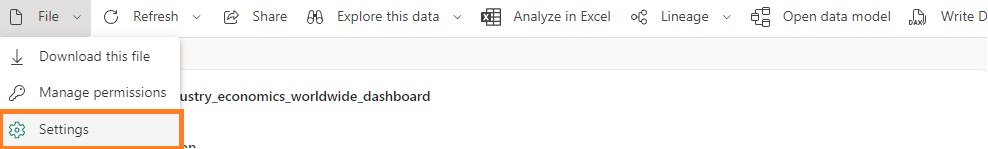
- To configure the access, click on the three dots next to Edit on the top ribbon and select View semantic model.
- Then click on File > Settings.
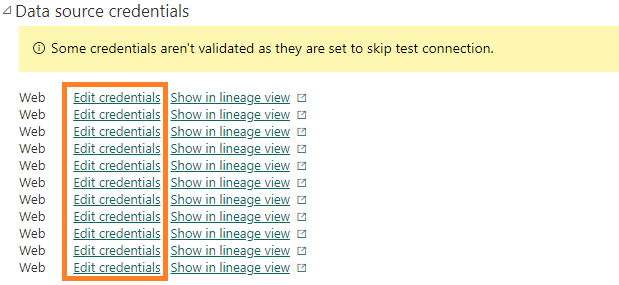
- Under Data source credentials, click on each of the Edit credentials buttons next to Web.
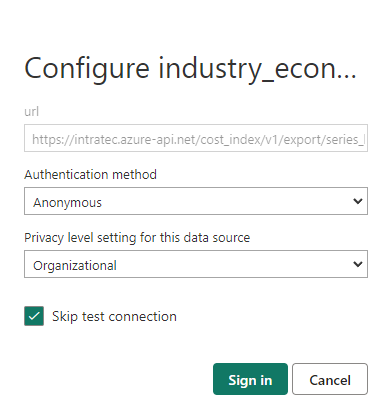
A pop-up will open to configure access to the Intratec APIs. Set it up as displayed below and click Sign in:
- On the left column, click on the Semantic model icon.
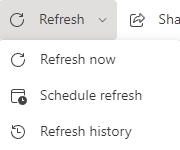
- On the top ribbon, click Refresh > Refresh now and wait.
If refreshing data is successful, it should look like this:
Get Available Series Information
Retrieve the lists of available assessments (data series) and their identification codes included in your subscription. Use these codes to request data, as explained in the Get Data and Historical Data section.
Step-by-Step
- With the dashboard open in the browser, click on the three dots next to Edit on the top ribbon and select View semantic model.
- Then click on File > Settings.
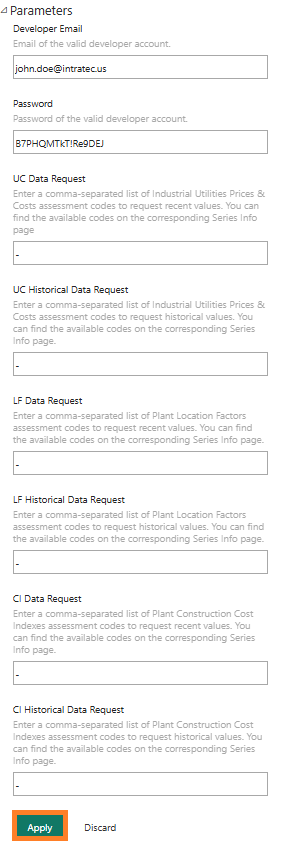
- Under Parameters, fill the credentials with a valid Developer account's Email and Password.
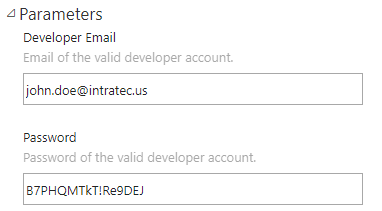
The above credentials refer to a courtesy account that has access to the free product data samples available on the website.
- Fill the remaining parameters with a hyphen (-), as shown below.
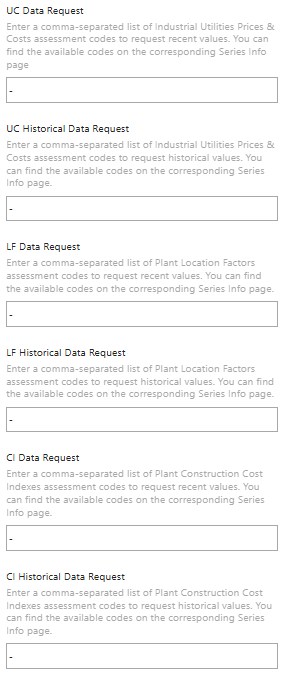
The above parameters are not required for retrieving the lists of available assessments. They will be used in the next section for retrieving assessment data.
- After setting up the parameters, click Apply.
- On the left column, click on the Semantic model icon.
- On the top ribbon, click Refresh > Refresh now and wait.
- On the left column, click on the Report icon.
The Series Info pages should now be filled with all the available assessments.
Get Data and Historical Data
Retrieve data series values by entering the desired assessment codes.
Step-by-Step
- After choosing which assessments to request, click on the three dots next to Edit on the top ribbon and select View semantic model.
- Then click on File > Settings.
- In the Parameters window, enter a comma-separated list of assessment codes in each of the desired Data Request parameters to retrieve recent assessment data.
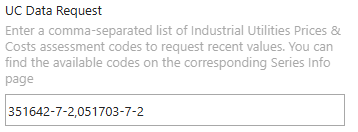
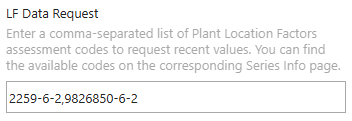
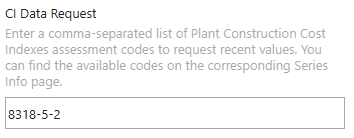
These parameters accept up to 40 codes each. To retrieve only historical data, enter a hyphen (-) in each parameter.
- UC Data Request accepts codes from Industrial Utilities Prices & Costs only.
- LF Data Request accepts codes from Plant Location Factors only.
- CI Data Request accepts codes from Plant Construction Cost Indexes only.
- In the Historical Data Request parameters, enter a comma-separated list of assessment codes to retrieve the historical data.
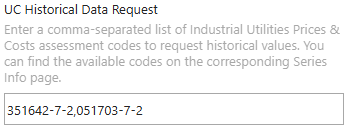
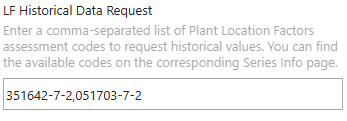
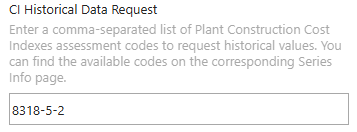
These parameters also accept up to 40 codes each. If you do not have access to historical data or do not wish to retrieve it, enter a hyphen (-) in each parameter.
- Click the Apply button.
- Click the Semantic model icon on the left column.
- Refresh the data by clicking Refresh > Refresh now and wait for it to finish.
- On the left column, click on the Report icon.
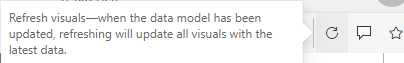
The requested assessment data is now available on the dashboard. If, after refreshing the data, the requested assessments still do not appear on the chart, simply click on the Refresh visuals button on the upper-right ribbon.
Querying Values in Another Currency or Unit (Industrial Utilities Prices & Costs only)
When querying data, the user may specify an alternate currency and/or unit of measurement to display the values. Available units and currencies for each assessment are displayed on the Industrial Utilities Prices & Costs - Series Info page. Currencies and units are identified by a number, which can be found in the Currency Reference and Unit Reference sections, respectively.
Specify a different output currency by adding &c={Currency_ID} after the code.
Example: The following code queries values in British Pounds (GBP), where {Currency_ID}=9: 73470-7-1&c=9.
Specify a different output unit by adding &u={Unit_ID} after the code.
Example: The following code queries values in normal cubic meter (Nm3), where {Unit_ID}=5: 73470-7-1&u=5.
Tip: Users can specify both unit and currency for the same code, regardless of the order of the parameters. 73470-7-1&u=5&c=9 is equivalent to 73470-7-1&c=9&u=5.
If an invalid {Unit_ID} or {Currency_ID} is provided, the values will be displayed in the default unit and currency.
Formatting Guidelines
When setting up the requests, make sure to properly format the list of assessments by following three simple guidelines:
- Request a maximum of 40 assessment codes per request.
- Leave the Historical Data Request parameters with a hyphen (
-) if the account is not entitled to access historical data. - Make sure the lists of assessments are properly formatted, and that all requested codes appear on the respective Series Info page.
Each time a new request is made, the results from the previous request are replaced. To avoid losing data, if you need to request data from multiple assessments and view them separately, Intratec recommends either downloading the data before making a new request or setting up multiple Power BI dashboards, each focused on a different group of assessments. This prevents unnecessary requests for the same data and ensures you do not lose previously retrieved information.
Download Data
Export the data from the charts and save it into a different file so you do not lose the retrieved assessment data before making a new request.
Step-by-Step
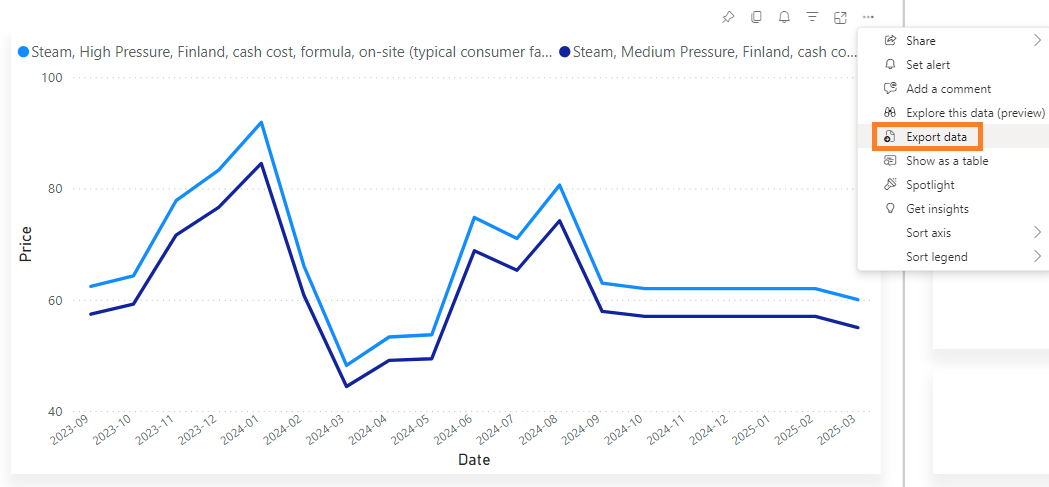
- On the upper-right corner of the graph, click on the three dots and select Export data.
- Then, select Summarized data to download only the information that appears on the chart.
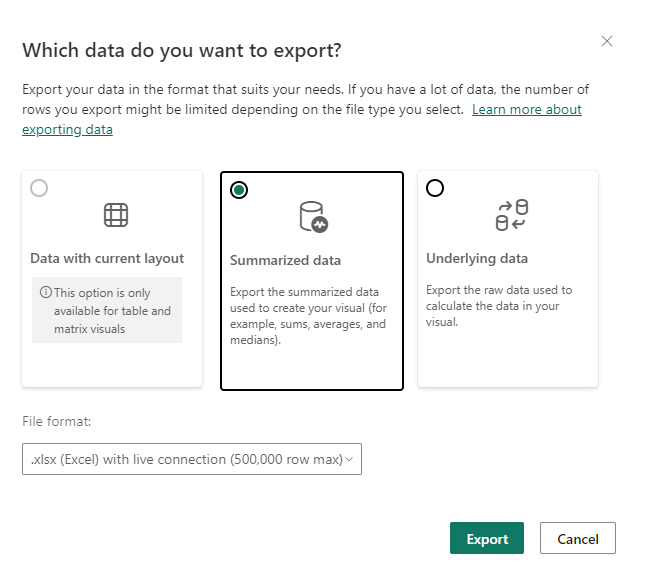
In this step, the user may also select underlying data to download all the data retrieved for the request made, including, for instance, the assessment code and the last final data point date.
- Under File format, select
.xlsx (Excel 150,000-row max).
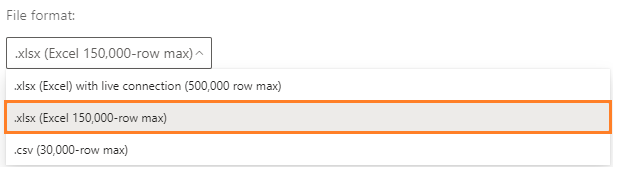
- Click Export and wait for the file to download.
Common Problems
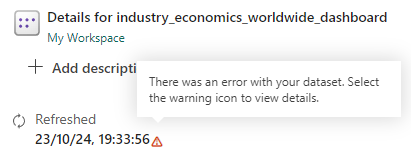
Wrong Input or No Access to the API
If there is anything wrong with the request, a warning symbol will appear next to the date and time of the last attempt to refresh the dataset:
By clicking the symbol, the user can see error details:
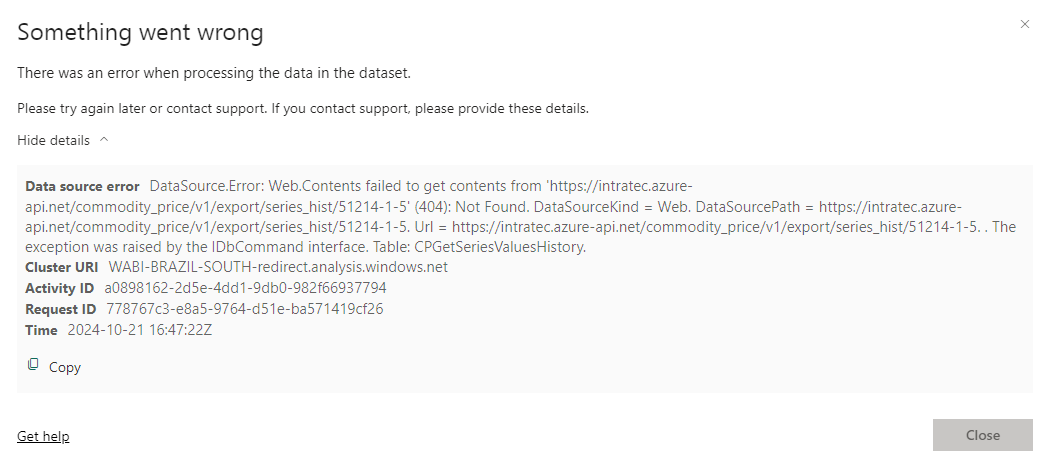
The error message displayed above appears when:
- More than 40 codes are added to the Data Request or Historical Data Request parameters.
- The user has added codes to the Historical Data Request parameters without having access to historical data. Check if your account has the required automation tier at https://www.intratec.us/account/log-in.
- The list of assessment codes is either not properly formatted or includes codes that the user does not have access to. Include only codes from the respective Series Info page of the dashboard, separated by commas and without spaces.
Misconfigured Data Source Credentials
The following error message is caused when one or more data source credentials were not configured properly:
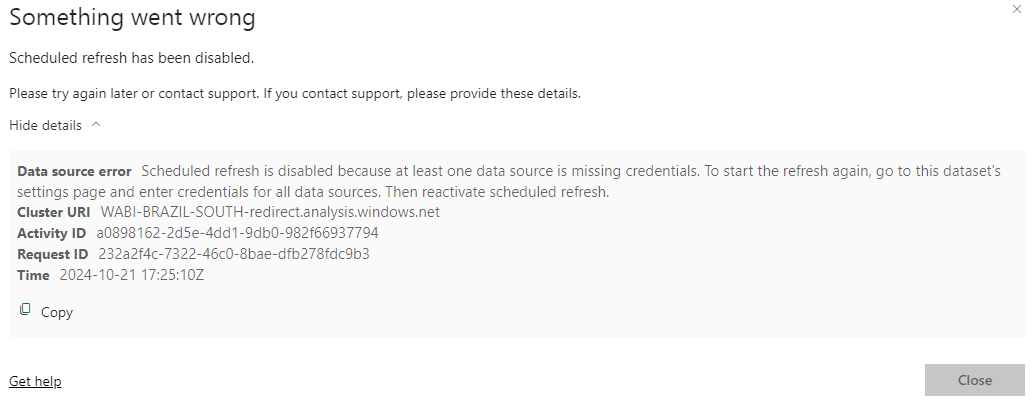
Follow the steps to fix it:
- Click on the Semantic model icon on the left bar.
- Then click on File > Settings.
- Under Data source credentials, find the connection and click Edit credentials.
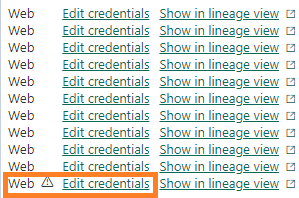
- Configure it as follows and click Sign in.
Currency Reference (Industrial Utilities Prices & Costs only)
Unit Reference (Industrial Utilities Prices & Costs only)
Questions & Feedback
For assistance, feel free to reach out at https://www.intratec.us/help/contact-us. We value your feedback. If you have complaints, compliments, or suggestions, do not hesitate to share them with us.